Business Education, CEO, Personal Finance

How is this a positive for Tesla stock?

CNBC reported “Revenue declined from $23.33 billion a year earlier and from $25.17 billion in the fourth quarter. Net income dropped 55% to $1.13 billion, or 34 cents a share, from $2.51 billion, or 73 cents a share, a year ago.

The drop in sales was even steeper than the company’s last decline in 2020, which was due to disrupted production during the Covid-19 pandemic. Tesla’s automotive revenue declined 13% year over year to $17.38 billion in the first three months of 2024.

Capital expenditures rose to $2.77 billion, up 34% from a year earlier.

Free cash flow turned negative in the quarter, with the company reporting a deficit of $2.53 billion. A year ago, Tesla reported free cash flow of $441 million, a number that reached $2.06 billion in the fourth quarter.”

Despite such numbers, Tesla shares jumped 11% after Musk reported that he is planning to manufacture affordable models in 2025. Does this mean that the market is looking at the future rather than the past? Click the URL below to read the article in CNBC. Ram Subramaniam

https://www.cnbc.com/2024/04/23/tesla-tsla-earnings-q1-2024-.html
Business Education, Personal Finance

I shouldn’t have taken your suggestion!

I got an angry email from a friend today. “I shouldn’t have invested in S&P 500 per your suggestion!” read the subject line. His problem was that more than 90% of appreciation in S&P 500 came from just 5 stocks – AAPL, GOOGL, AMZN, NVDA, and MSFT. “I should have invested in these 5 rather than in SPY which is made of 500 stocks,” he concluded. Here’s my counter argument.

This is a situation indicative of several possible market conditions.

  1. Market Concentration: This suggests that the market is highly concentrated, where a few large-cap stocks, probably technology or other high-growth sectors, are driving the performance. This could create a situation of increased risk, as the market’s health is heavily dependent on the performance of a handful of stocks.
  2. Market Imbalance: Such a situation may imply an imbalance in the market, reflecting that other areas of the market might be undervalued or underperforming.
  3. Investor Sentiment: It might show a trend in investor sentiment, favoring these five companies, possibly due to perceived growth potential, strong fundamentals, or other favorable conditions.
  4. Economic Conditions: It may reflect broader economic conditions. For instance, during a period of rapid technological advancement, tech stocks may disproportionately drive market performance.

While such a concentration can lead to significant short-term gains, it may also increase the market’s vulnerability to shocks, as a downturn in these few stocks could have outsized effects on the market as a whole. Diversification, or spreading investments across a variety of stocks and sectors, is often recommended to mitigate this type of risk. It’s important for investors to understand the implications of this concentration.

He is still not convinced! What do you think?

Business Education, Options Trading, Personal Finance

Investing for the Long Term!

As I was reading an article on Personal Finance, the following question came to mind: how much would a 10000 Rupees monthly investment in NIFTY since the year 2000 would be worth in December 2020? NIFTY is an index of Indian Equities and I was surprised by the ROI! Read on.

To estimate the value of a 10,000 INR monthly investment in the NIFTY 50 since the year 2000 until December 2020, we can use historical data for the NIFTY 50 index and a method called dollar-cost averaging. Keep in mind that this calculation is an approximation and does not take into account taxes, fees, or dividends received, which would affect your overall returns.

Using historical data for the NIFTY 50 index and the monthly closing prices, you can follow these steps:

  1. Divide the 10,000 INR monthly investment by the closing price for that month to find the number of units (or a proxy of shares) purchased each month.
  2. Keep a running total of the number of units accumulated over the investment period.
  3. Multiply the total number of units by the closing price of the NIFTY 50 index in December 2020.

For example, using historical data from Yahoo Finance, the closing price of the NIFTY 50 in January 2000 was approximately 1,475, and in December 2020, it was approximately 13,981.75.

By investing 10,000 INR every month from January 2000 to December 2020, you would have invested a total of 2,520,000 INR over the 252 months. After calculating the number of units purchased each month and summing them up, you would have accumulated around 153.34 units (or a proxy of shares) of the NIFTY 50 index.

Multiplying the total number of units (153.34) by the closing price in December 2020 (13,981.75) gives you an approximate value of INR 2,144,250.69.

Please note that this is a rough estimate, and individual results may vary depending on factors like exact investment dates, fees, and reinvestment of dividends. Additionally, this calculation assumes that the monthly investments were made at the end of the month, which might not match your actual investment schedule.

Business Education, Options Trading, Personal Finance

Trades for March 2023

Here are my trades for Mar. Sold a few naked puts and all of them expired. Got to keep the premium.

Sold the following puts on SPXL.

Mar 17th, $59

Mar 24th, $55

Sold the following puts on AMZN.

Mar 10th, $88

Mar 24th, $90

Mar 31st, $90

Sold the following puts on OXY

Mar 24th, $52

Sold the following on TQQQ

Mar 31st, $24

All of them expired. I kept the premium!

Business Education, Options Trading, Personal Finance

My trades for Jan 2023. I forgot…almost!

I have been getting a bit sloppy! Actually, I got a bit busy with classes. Here are my trades for Jan 2023. I have decided to trade a bit rather than investing for a couple of months. None of these naked puts got exercised. Hence, I got to keep the premium.

I sold the following puts on SPXL.

Jan 13th, $58.50

Jan 20th, $60

Jan 27th, $63

Jan 27th, $68

All of them expired.

Business Education, Career Management, Personal Finance

Inflation Education and Education Inflation!

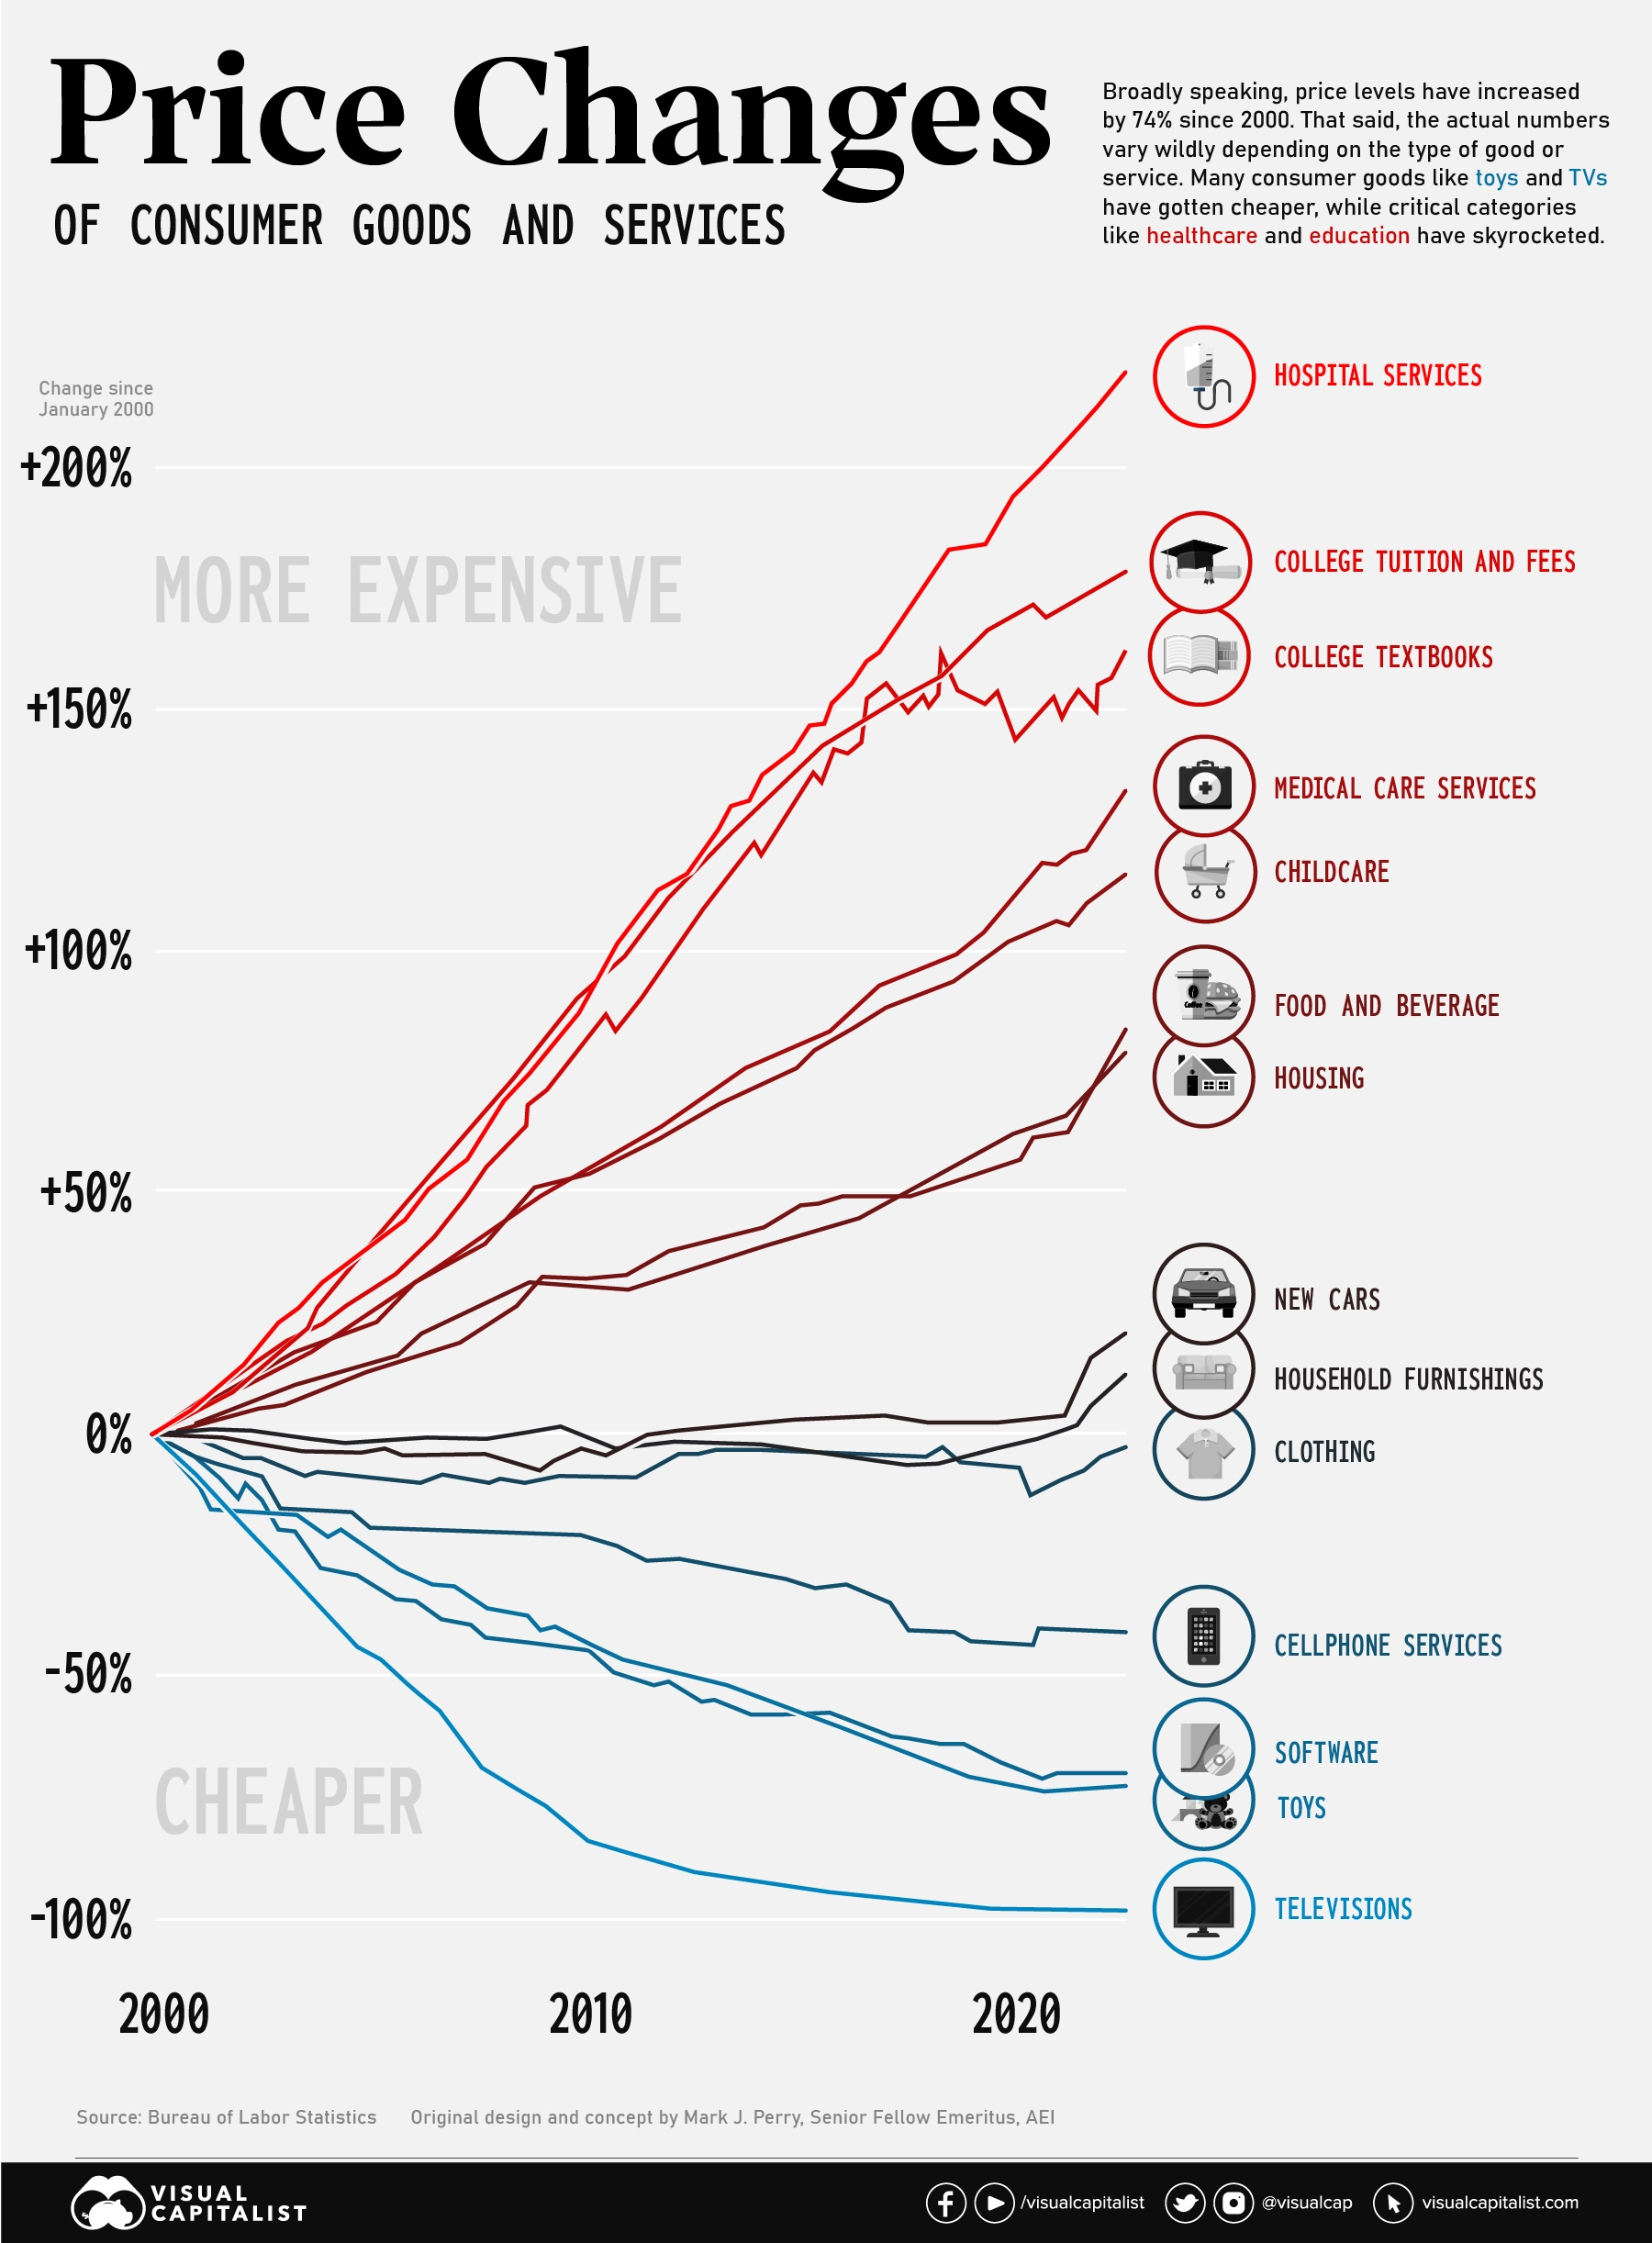
Looks like many things have gotten more expensive since Y2K. Hospital services topped the list with more than 200% inflation! I’m not surprised but I take little solace in knowing that better medicines and quality treatment options may have contributed to higher costs. Can you guess which sector was a close second in high inflation? Education! To be more precise, tuition and text book costs. I wanted to start cursing when I saw that the prices in education sector in 2023 were 175% of those in 2020. Did the quality of education improve? Did the quality of professors improve? No and No! Then, what explains this unreasonable price increase? College degrees have become status symbols. Universities have figured that the society is obsessed with fancy degrees. I hate to say this, but Peter Thiel may have a point! As long as we don’t examine the ROI of college education before we enroll, universities have no incentive to care! With costs getting higher and higher, no wonder it’s called higher education! click on the image below to read the full report from WEF.


null

Business Education, Options Trading, Personal Finance

Back in Action!

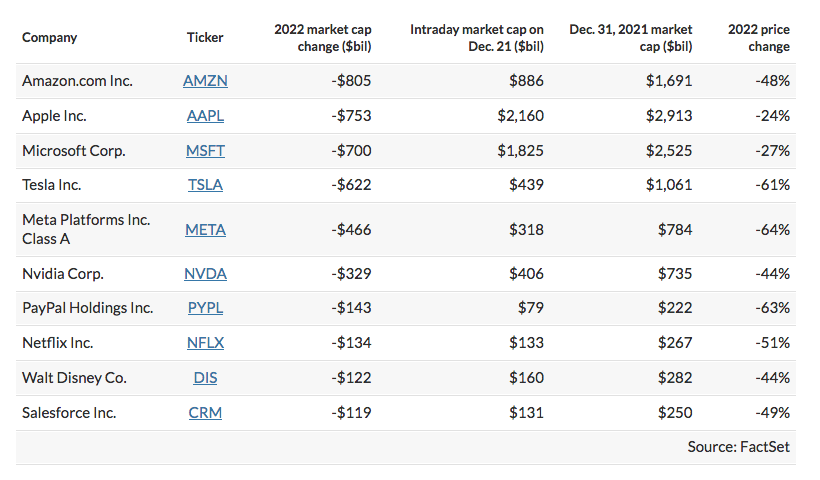
In May this year, fearing that Putin may go crazy with weapons of mass destruction in Ukraine, I decided to stay away from investing. I was right, but for wrong reasons. I would file it under ‘got lucky’ column. So on October 27th, when Facebook (called META nowadays!) fell by more than 25% and lost about 80 Billion$ in market cap, I thought I would sell some puts. I sold Oct 28th $95 puts. Thankfully, META stayed above $95 and I got to keep the premium. But by Nov 3rd, it fell to $88. I’m watching it carefully even as it reaches $113 on Nov 11th. I’ll make a decision about buying some this week. Facebook fell from $350 to $88! AMZN fell to $85 from $188 and GOOGL to $83 from $151.

Business Education, Personal Finance

My Trades for May 2022

The indices I watch SPY, QQQ, and FAS are at interesting levels – they are approaching pre-Covid levels but not there yet.  Does this mean these indices won’t go down further? No. They may. Also, interest rates are coming down a bit. So I have decided to carefully and sold the following puts.

Sold 20 TQQQ June 17, $21 Puts – $0.71

Sold 20 FAS June 17, $60 Puts – $0.72

Why $21 strike price for TQQQ? That was the price it was selling in Dec 2019! I’m willing to buy TQQQ at $21.

Why $60 strike price for FAS? That’s was the price it was selling in Oct 2017! I’m willing to buy FAS at $60!

I’m willing to buy TQQQ at $21 and  FAS at $60! Remember my discussion on time travel? But why June 17th? Travelling to mother India on 16th! Let’s see how these trades pan out. Good luck!

Business Education, Fintech, Personal Finance

My Feb 2022 Trades

I stayed away from the market in Dec and Jan. Here are my trades for Feb. I’m not sure what’s going to happen in Ukraine. So going to stay in cash and away from investing till end of June.

Sold 5 puts – FAS strike price 110 for Feb 4th – $450 – Expired.

Sold 3 puts – FAS strike price 120 for Feb 11th – $390 – Expired.

Sold 5 calls – FAS strike price 130 for Feb 18th – $2000 – Expired.

Sold 5 puts – FAS strike price 85 for Feb 18th – $950 – Expired.

Sold 5 puts – TQQQ strike price 35 for Feb 18th – $700 – Expired.

Sold 20 puts – SPXL strike price 70 for Feb 18th – $1400 – Expired.

Business Education, Fintech, Personal Finance

My Trades for December 2021

Back to selling naked puts! But traded on FAS for fun. Here are my trades for Dec.

Transactions

Bought 200 FAS at $124.00 and sold at $126.60.

Sold 10, Jan 22, TQQQ 60 puts for $1.70 & Bought it back at $0.03. Any idea why?

Sold 10, Jan 22, RIVN 70 puts for $3.30 (too attractive to pass)

Sold 10, Jan 22, RIVN 55 puts for $1.45 (too attractive to pass)

Sold 10, Jan 22, PTON 35 puts for $1.40 (just experimenting)